CATEGORY
Editorial
Report
Graphic Design
Infographics
DESCRIPTION
This UNHCR report examines how climate change, conflict, and forced displacement intersect, revealing the growing vulnerability of millions of people living on the front lines of environmental crises. My design approach focused on translating complex data and urgent humanitarian messages into a visually coherent and emotionally engaging document. The goal was to maintain the institutional seriousness of UNHCR while making the content accessible, contemporary, and human.
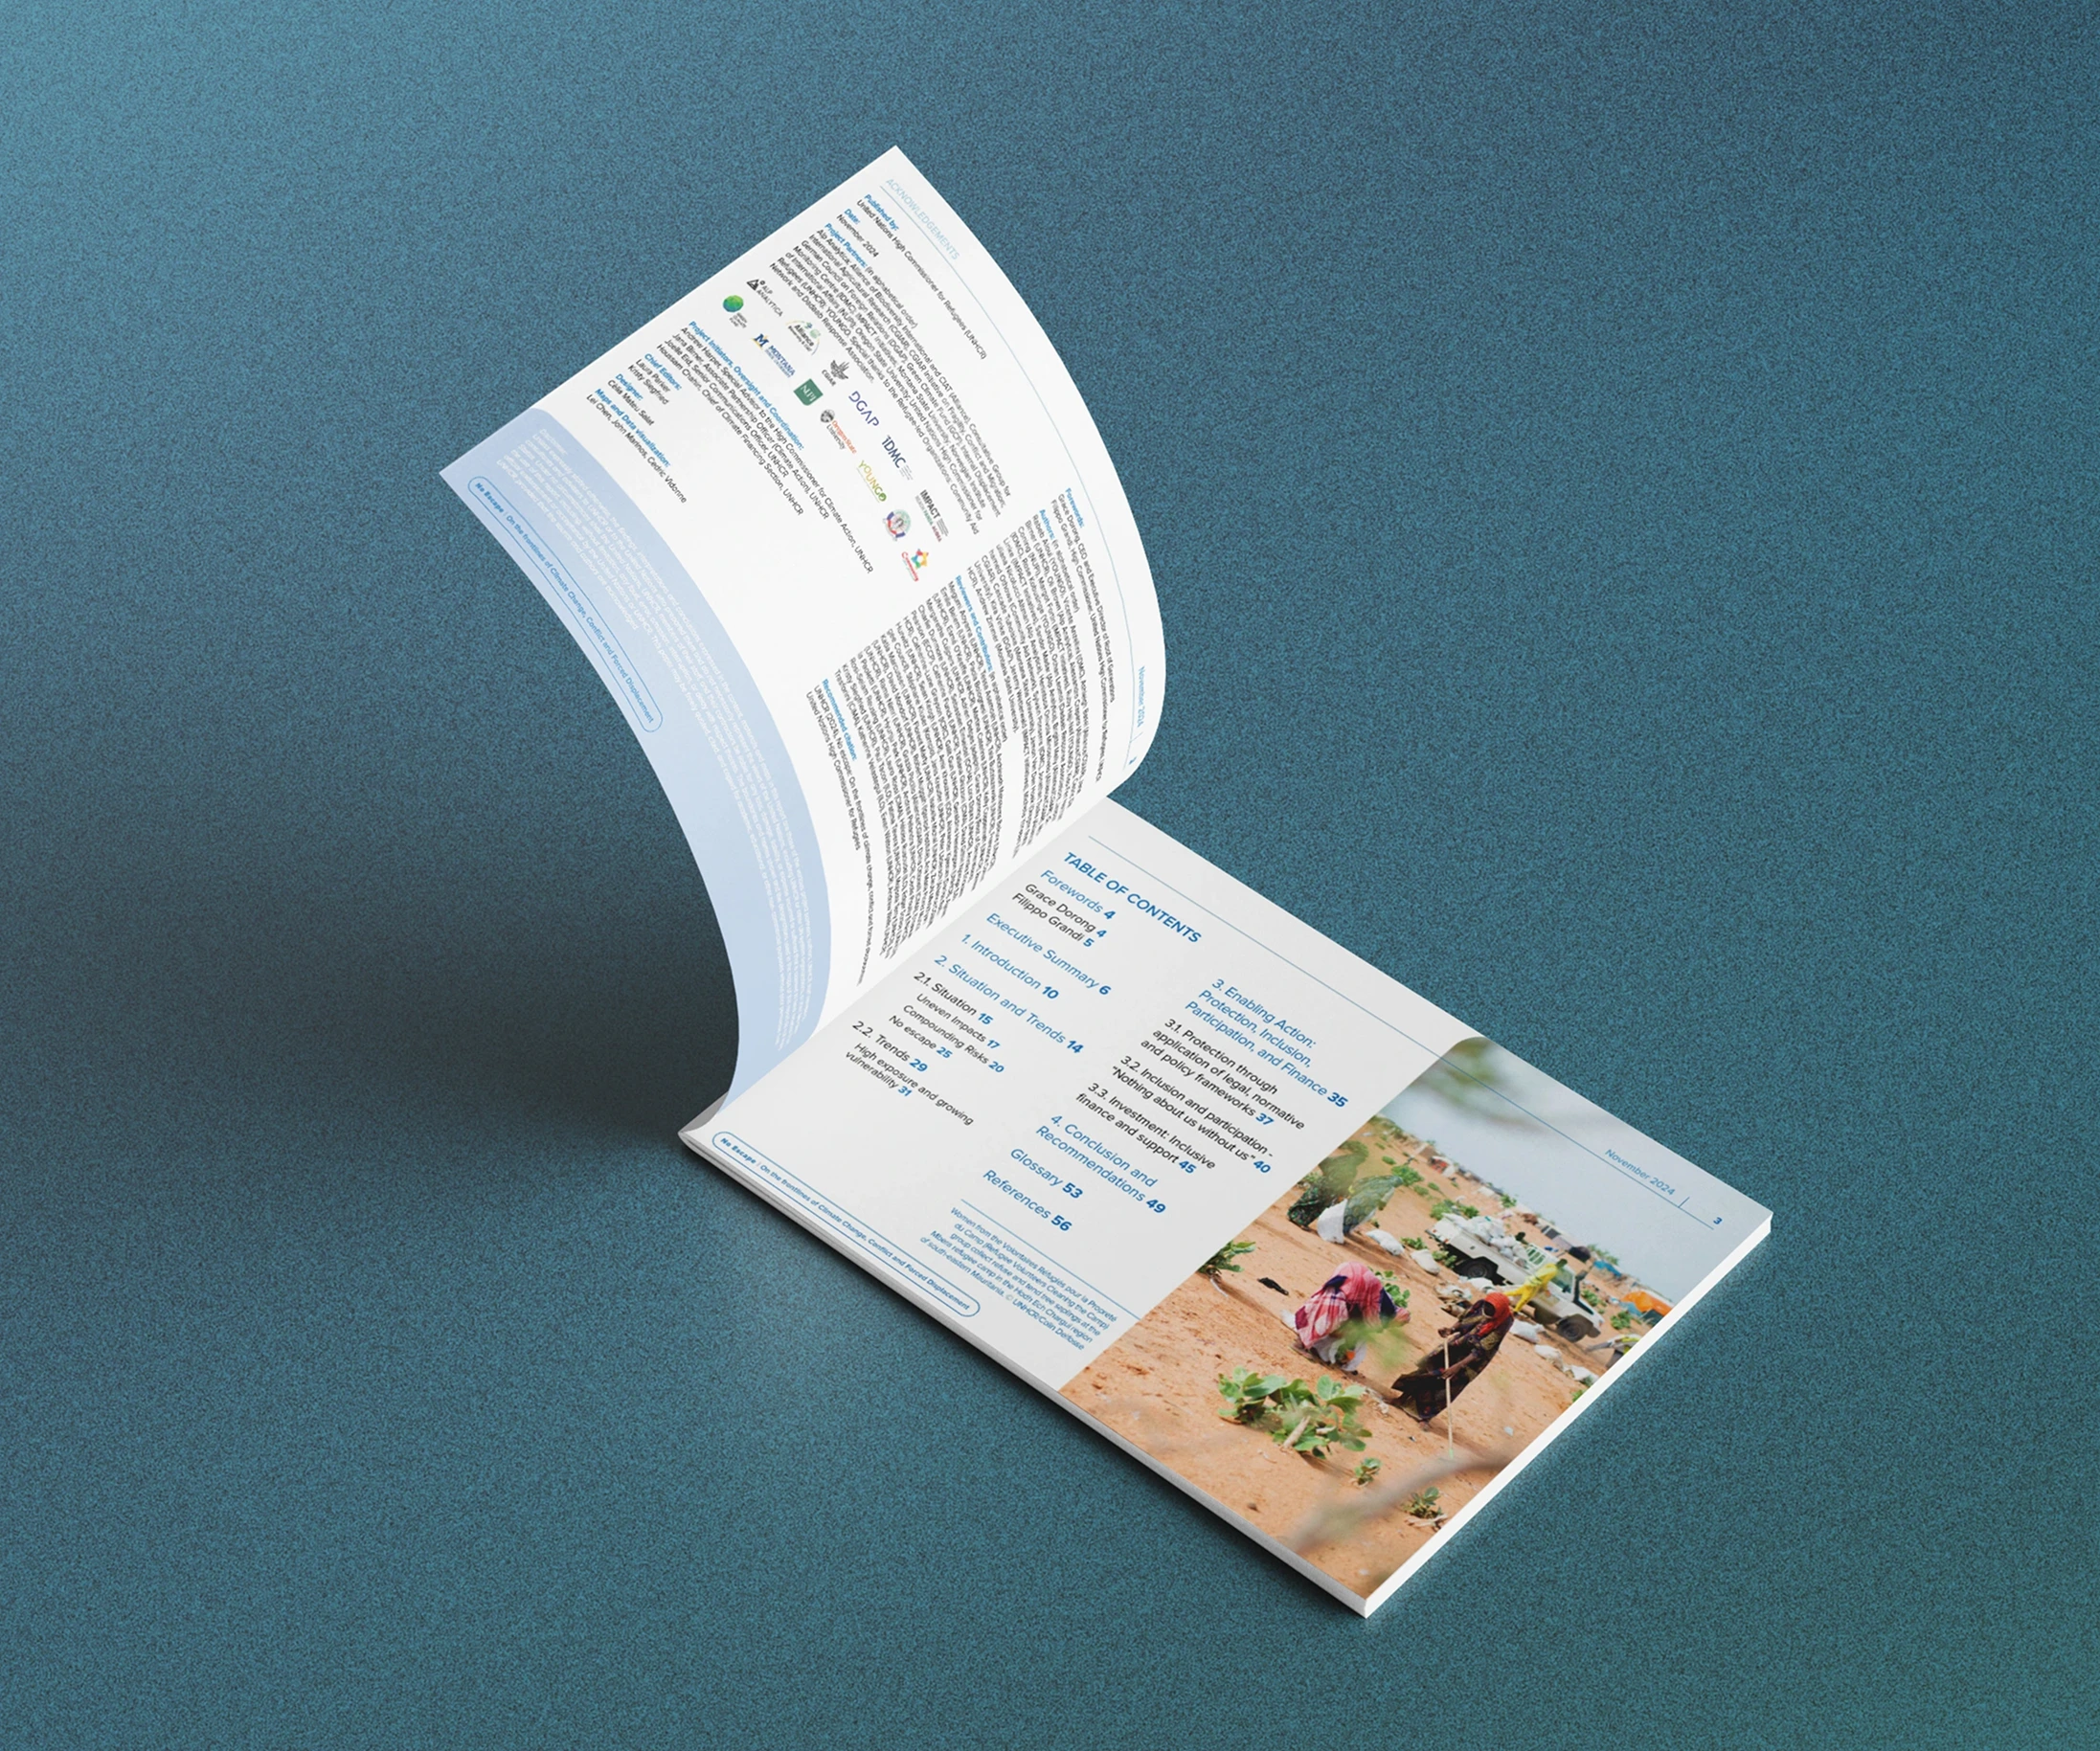
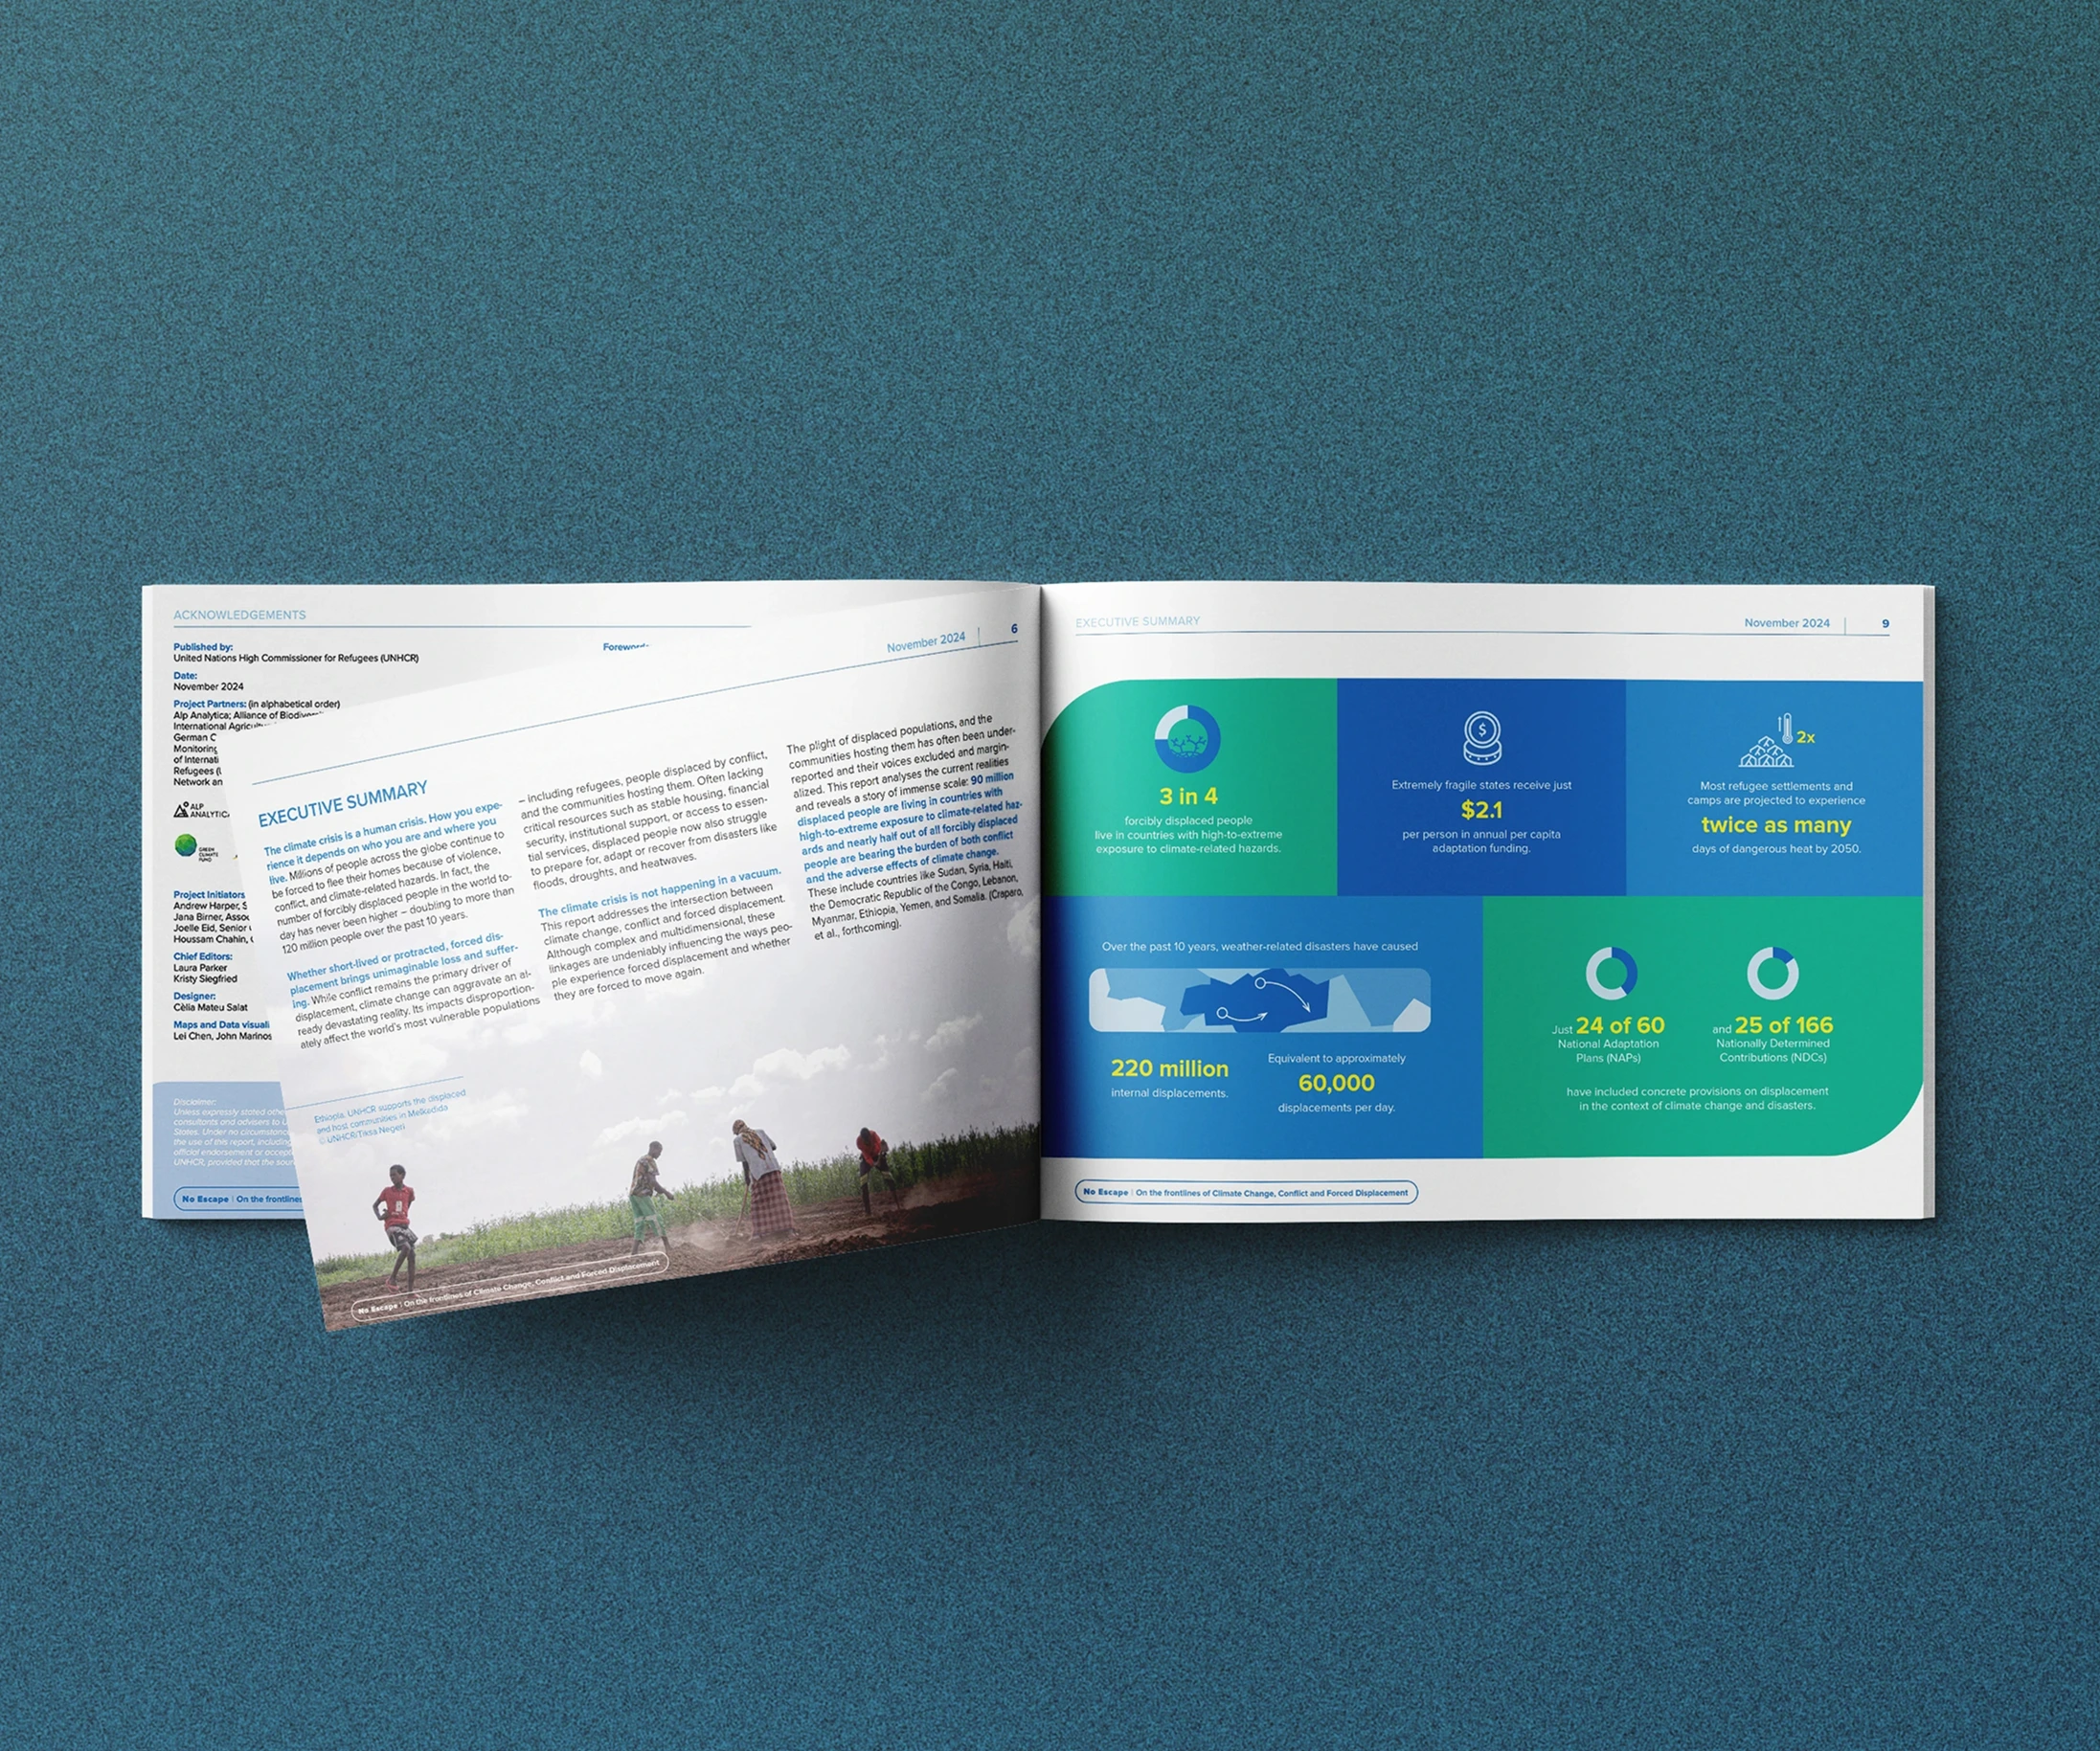
Design and Format
The overall design embraces clarity and structure. A clean grid system, visual clarity, and the use of UNHCR’s corporate blue as the core visual anchor and yellow and green to highlight and add diversity and create a modern yet institutional aesthetic. The layout alternates rhythmically between dense analytical sections and spacious narrative spreads, ensuring a smooth reading experience across languages and formats, both print and digital.
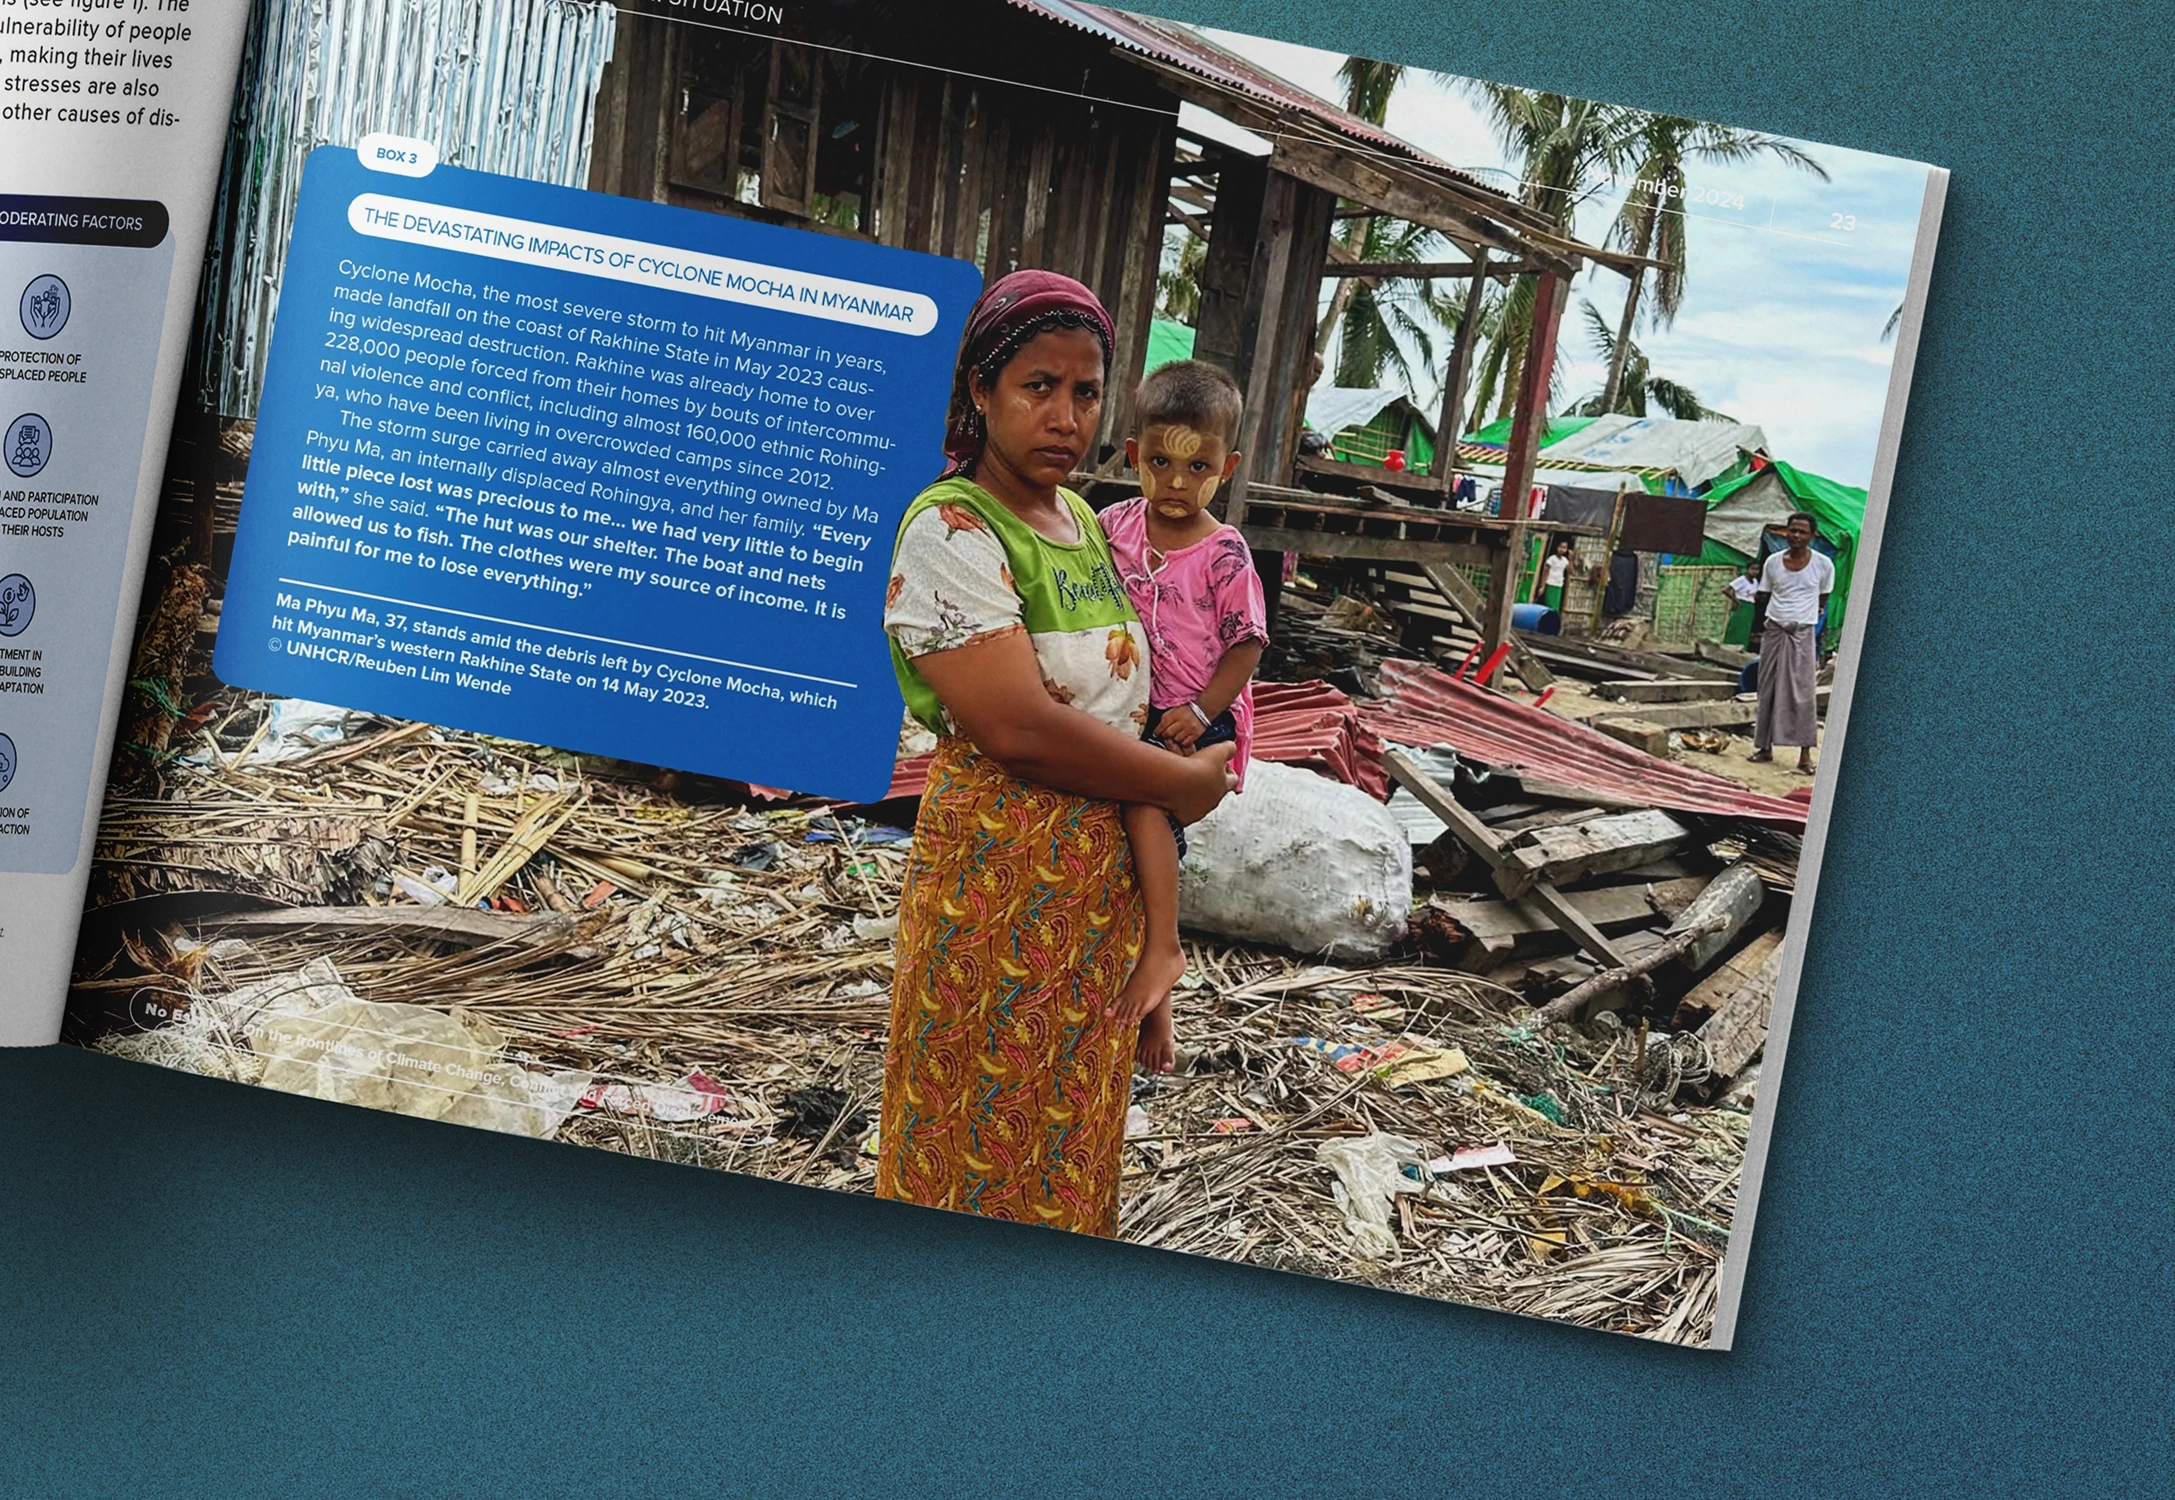
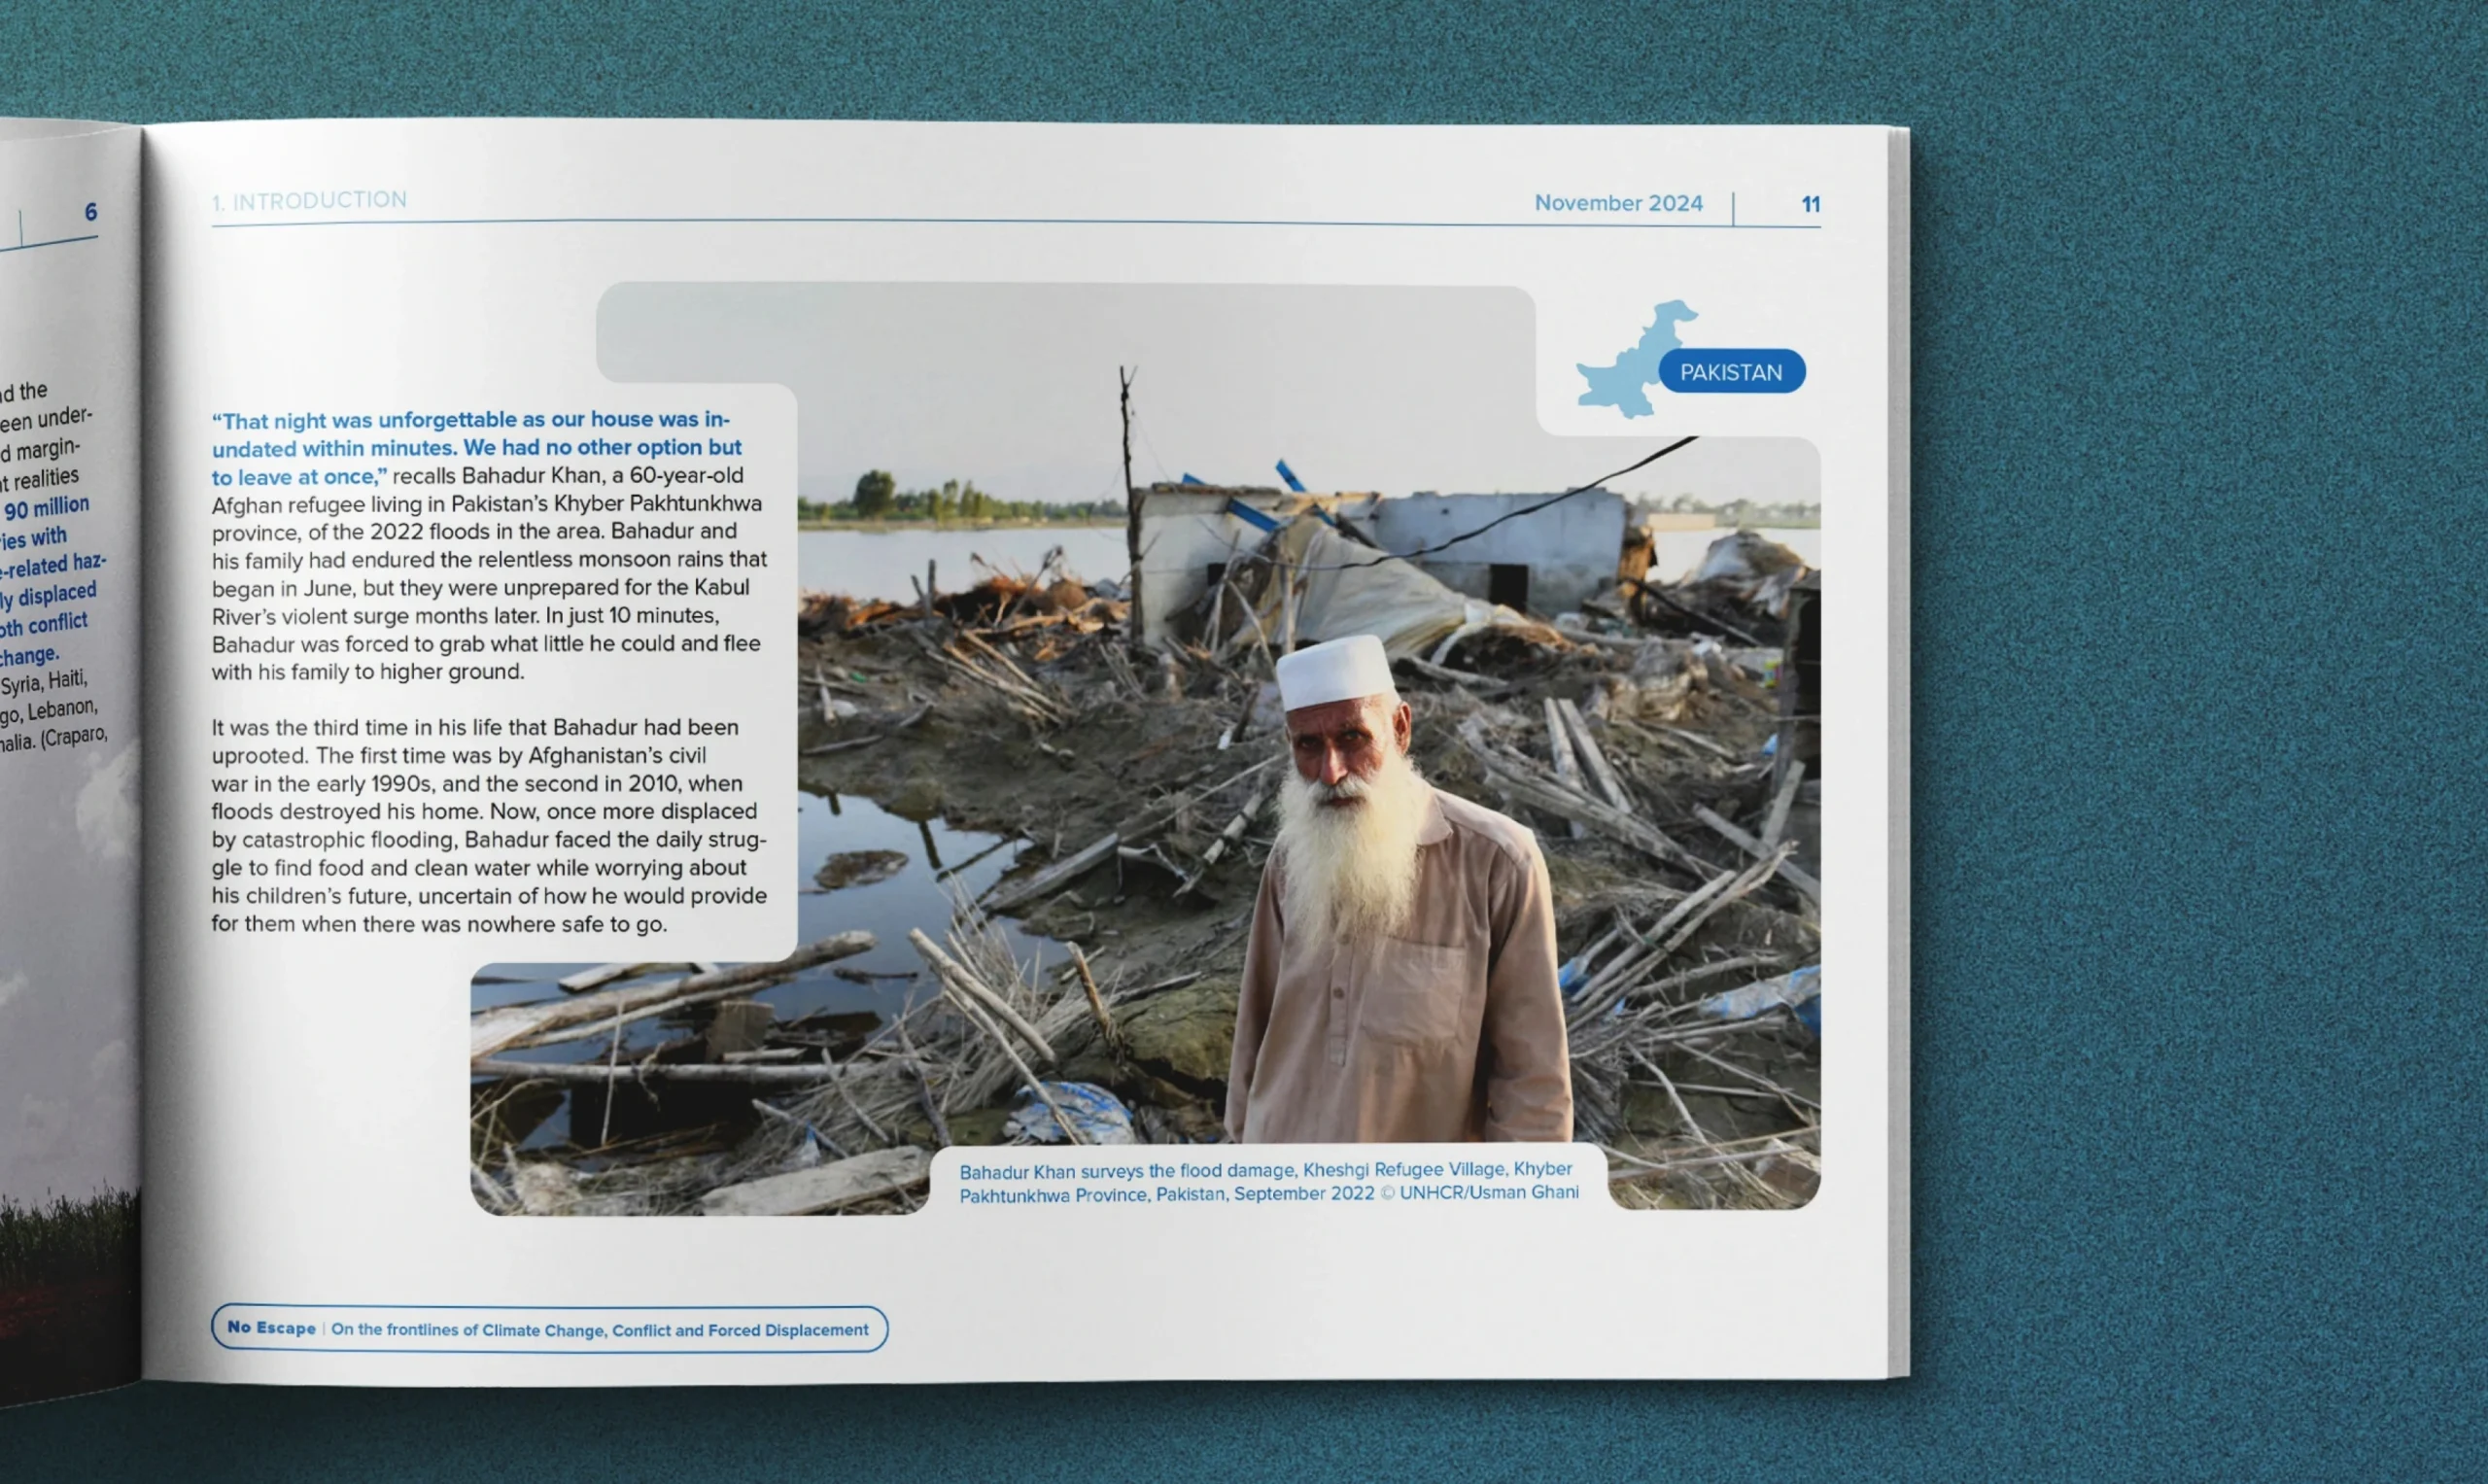
Imagery & Visual Narrative
The visual direction relied on a balance between documentary photography and data visualization. Each image was selected to reflect both the human impact and the global scale of the crisis — from portraits of displaced families to wide environmental shots of droughts, floods, and deforestation. Personal stories were integrated throughout the layout to bring emotional depth and to punctuate the flow of analytical content. The imagery follows a muted, natural tone palette to match the UNHCR visual identity, creating harmony between text, photo, and data.
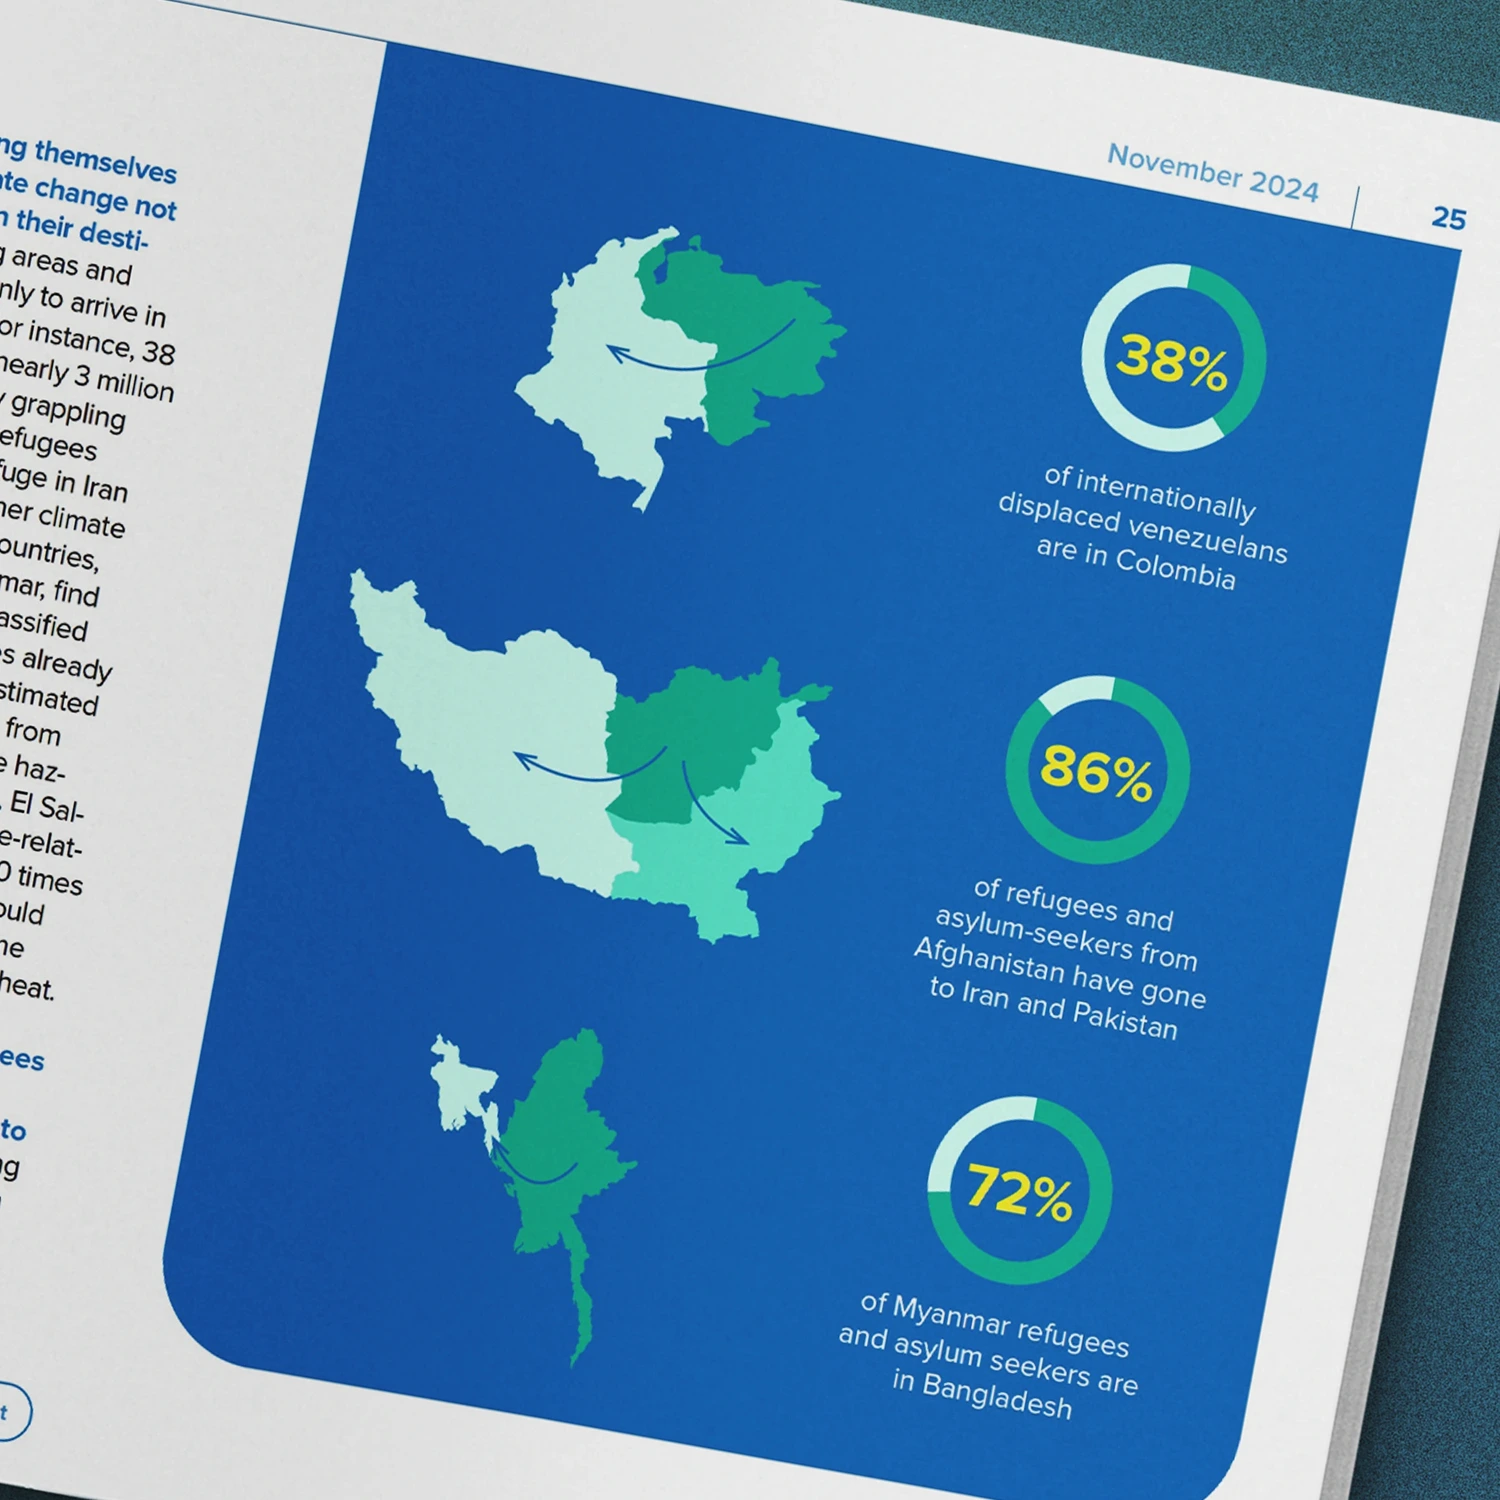
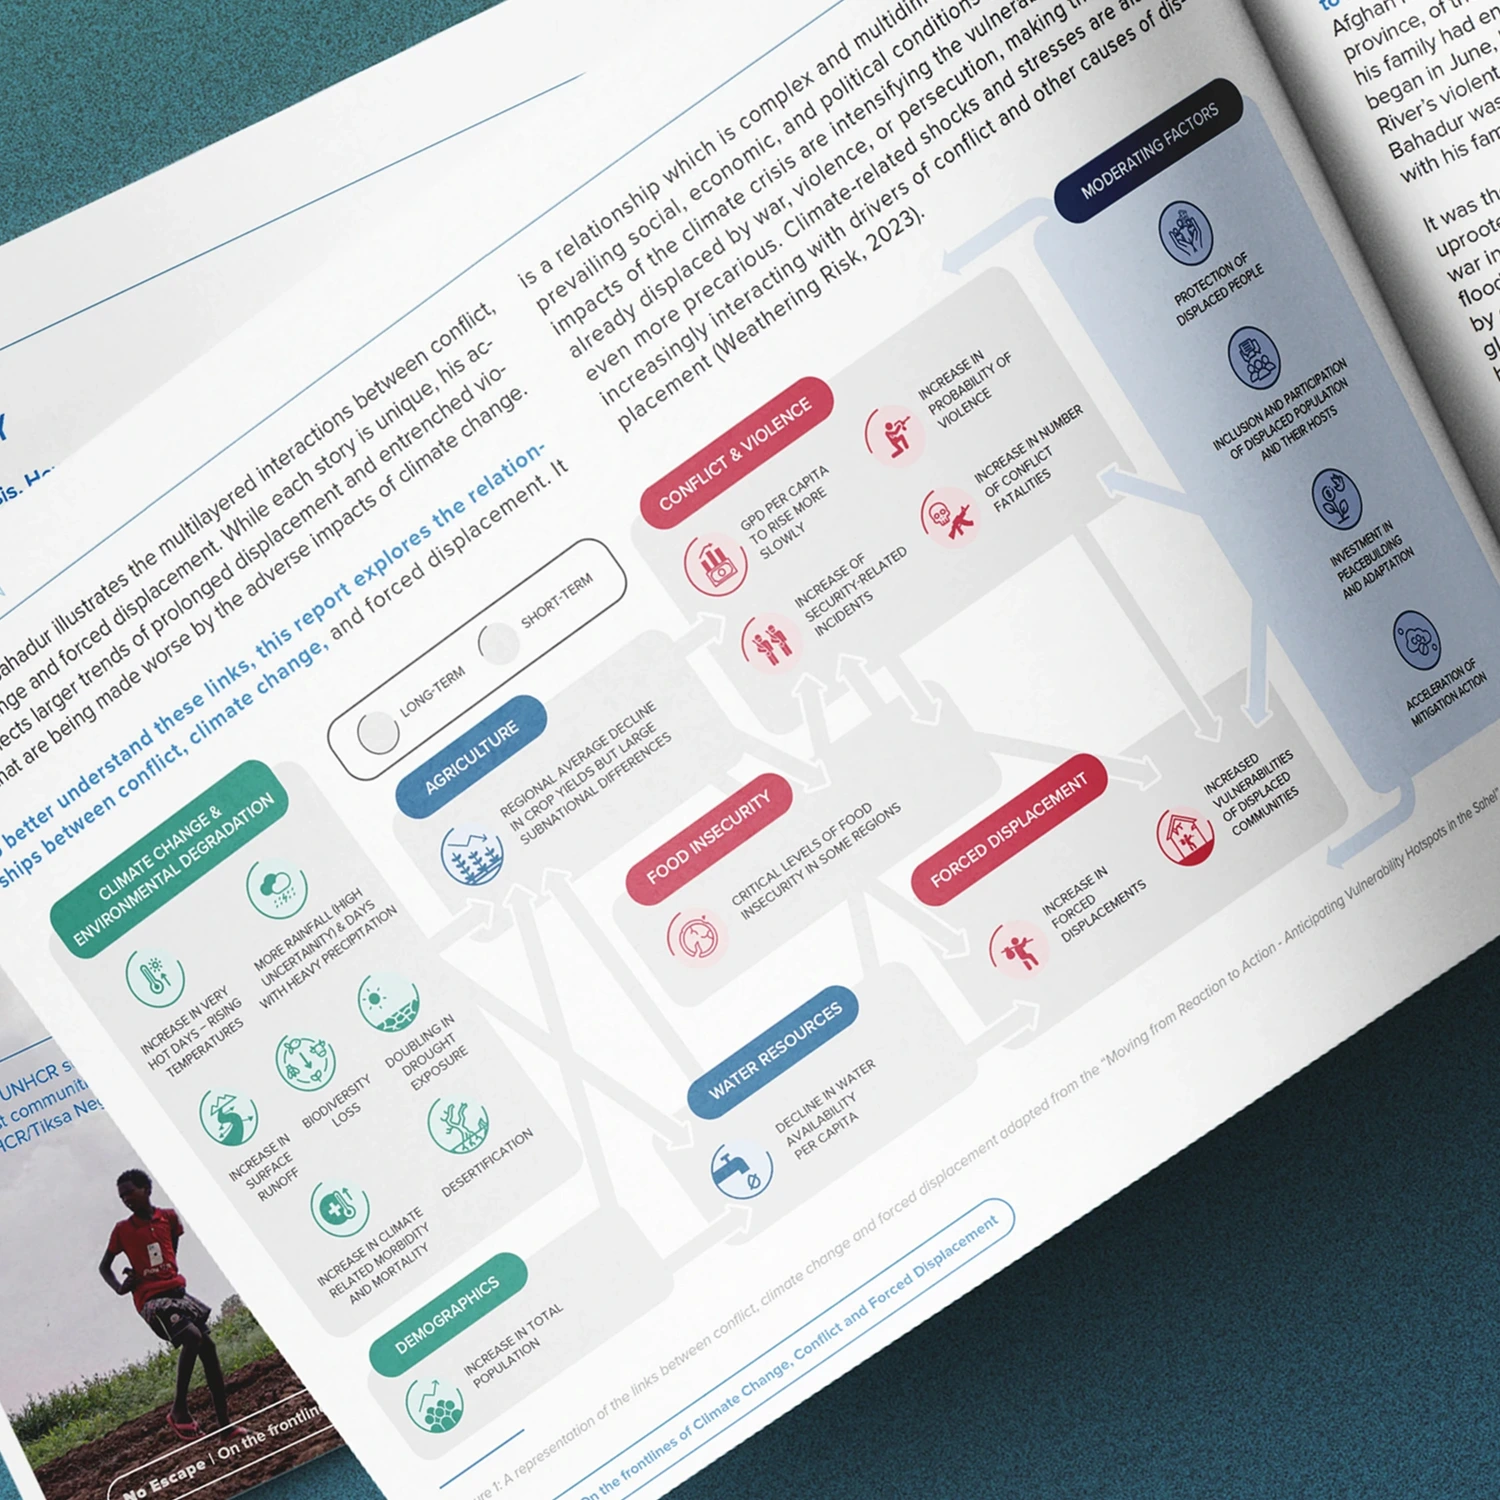
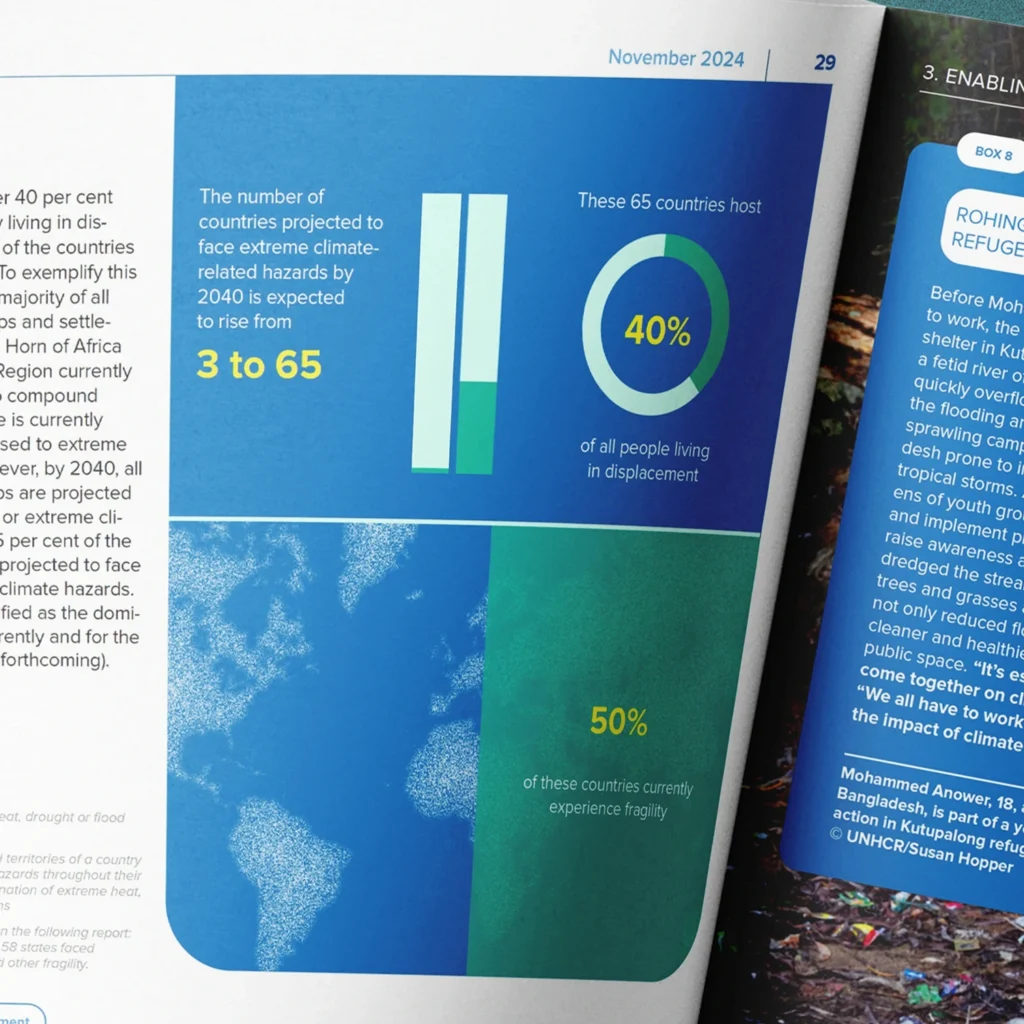
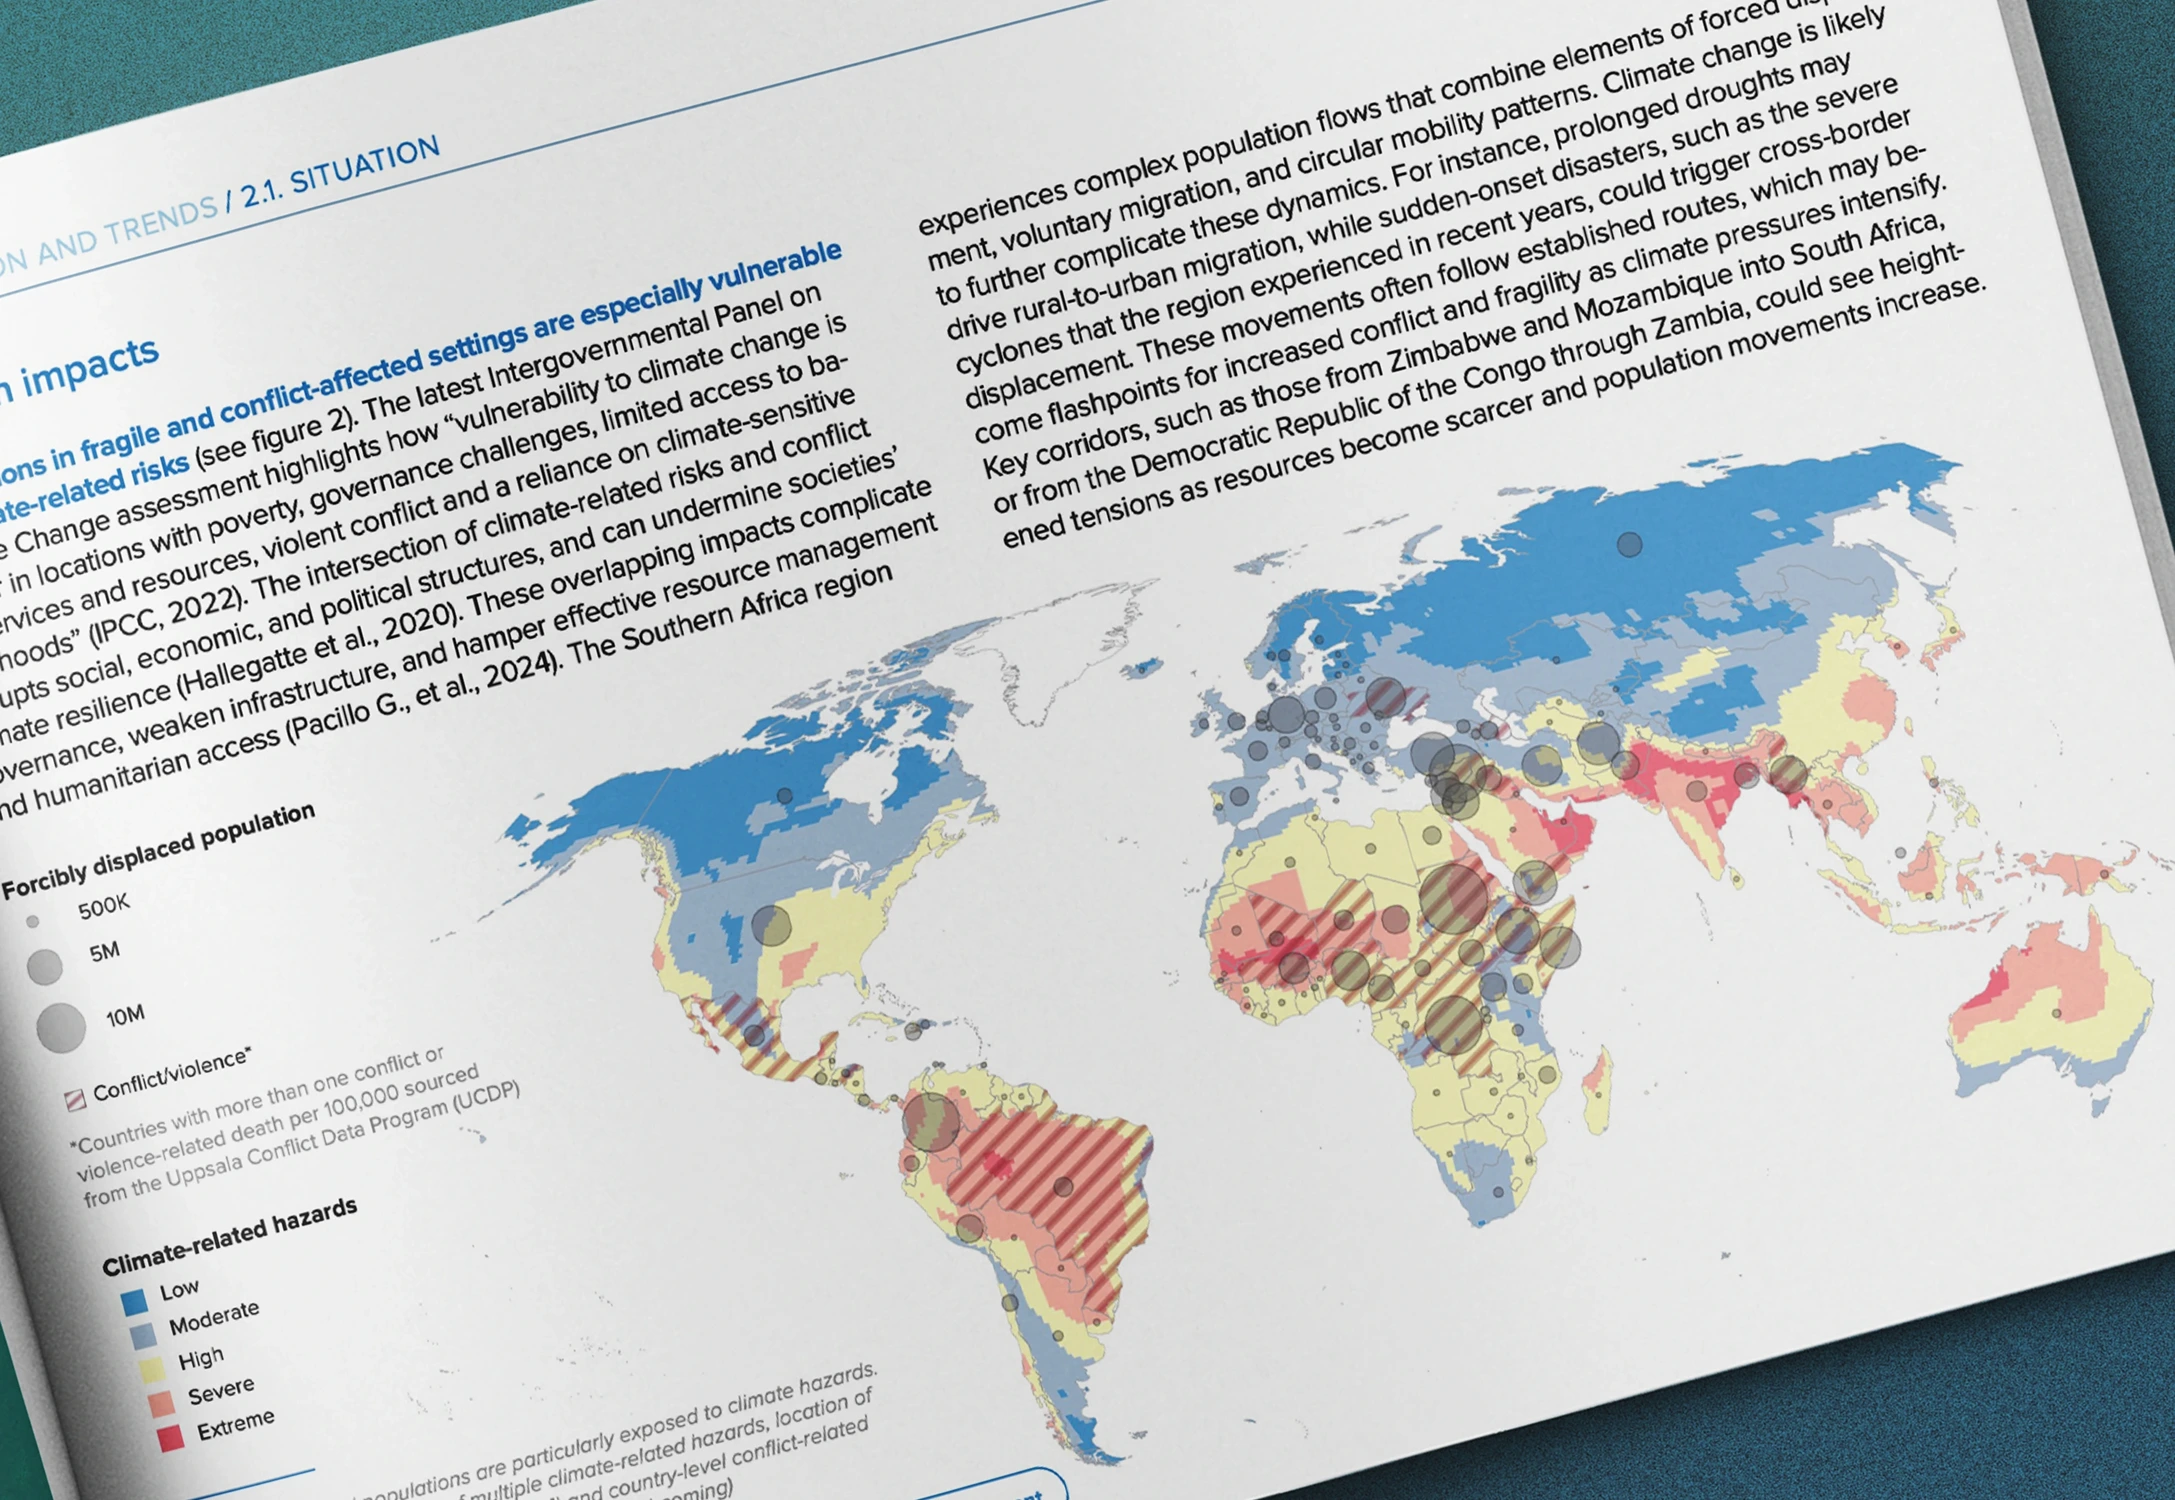
Infographics and maps
Data visualization played a central role in conveying the magnitude of displacement and climate risk through infographics and scientific maps that transform technical information into clear visual storytelling. The color coding followed UNHCR guidelines but introduced gentle accent hues to guide interpretation without losing coherence. These visuals were key to connecting numbers with narratives, turning abstract data into accessible insight.